Great Gatsby Curve
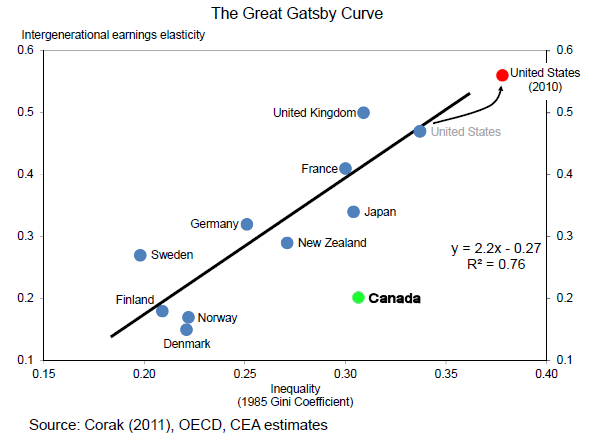
The graph above is called the Great Gatsby Curve. Along the x axis, it measures economic
inequality. Note that the USA is the furthest right of the developed countries shown. It has the most wealth
disparity. Along the y axis, it measures social stratification, i.e. how tilted the economic playing field is, in
other words, to what degree does a talented, hard working poor person have no chance of becoming rich. Note the USA
is at the top because there economic opportunity is only for the rich. Most Americans are under the delusion their
country has an unusually level playing field, where anyone who works hard can make his fortune. That was true
decades ago, but no longer. The wealthy are now a closed, exclusive club. In 2007, the
top 20% owned 85% of the wealth and the top 1% owned 36%. It is even more skewed now. If you don’t inherit a
fortune, your odds of making one are much better in any country but the USA. The graph also shows that wealth
inequality and a tilted playing field are inextricably linked. Tilted playing fields are how the rich become super
rich. You can’t have one without the other.